TABLE OF CONTENTS
Transport of Oxygen in respiration
Oxygen is transported in blood in two forms as physically dissolved O2 and O2 in combination with hemoglobin.
1. Physically dissolved O2
The O2 diffuses across the alveolar membrane and the lung capillary endothelium into the blood plasma where it is physically dissolved according to its solubility co-efficient and partial pressure. 0.003ml of O2 is dissolved in 100ml plasma at a PO2 of 1mmHg.
At a PO2 of 100mmHg, 0.31ml O2 gets dissolved in each 100ml blood
2. Transport of O2 with hemoglobin
After entry into the blood plasma, most of the O2 enters across the red cell membrane into the cell. The major portion of O2 is carried by blood is not in physical solution but is associated with haemoglobin molecule inside the red cells.
If plasma is exposed to an atmosphere of 100mm.Hg partial pressure of O2 only 0.3ml of O2 is taken up, But when blood is similarly allowed to equilibrate at an O2 tension of 100mmHg, it can carry 19 – 20 ml of O2/ 100ml of blood.
Hb present within erythocytes does the extra uptake.
Each Hb molecule contains 4 heme groups. Each heme molecule contains one Fe++ atom in a reduced state.
Each molecule of Hb can combine with 4 molecules of O2 depending on the relative concentration of Hb and O2 in blood. When reduced Hb combines with O2 it has been oxygenated then it is called Oxy – Hb.
Oxygen binding with Hb is a four step process; the O2 affinity of a particular heme is influenced by the oxygenation of other hemes in that haemoglobin molecule. These heme-heme interactions are responsible for the sigmoid shape of the oxyhemoglobin curve.
Greater the concentration of Hb in blood greater the amount of O2 carrying capacity.
At 150 mm Hg PO2, the blood is nearly saturated.
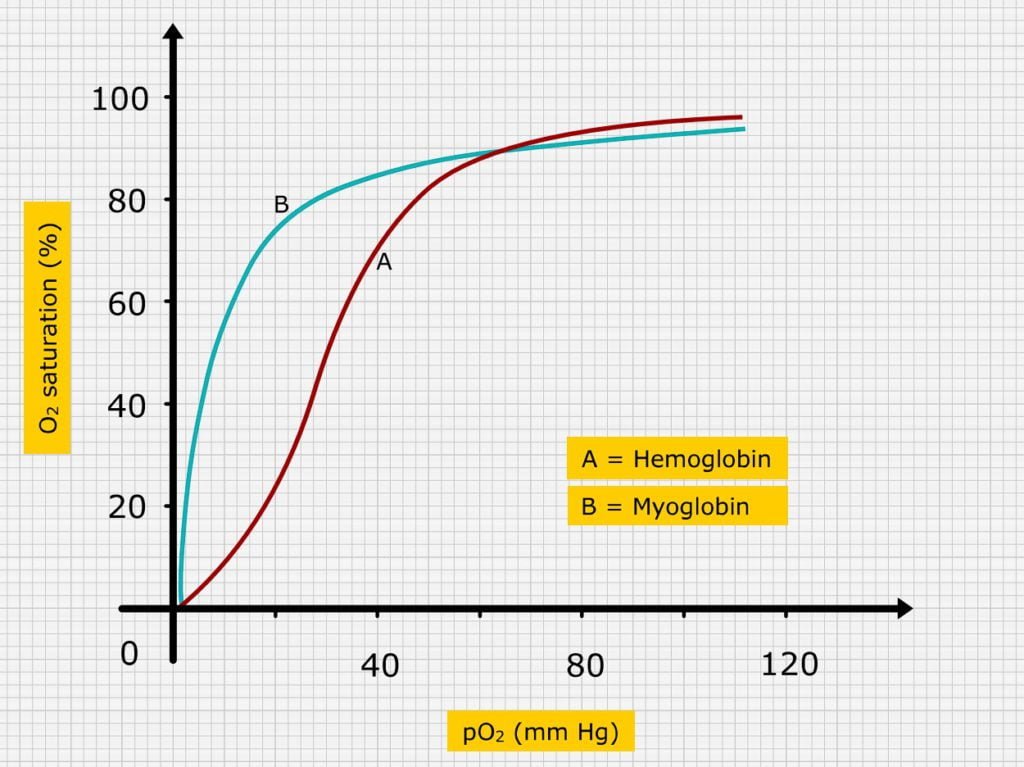
OXY HEMOGLOBIN DISSOCIATION CURVE
The Loading and unloading of O2 ability of the Hb in the form of a graph referred as oxy – hemoglobin dissociation curve.
This graph is obtained when the Hb is allowed to equilibrate with various PO2 and the values of percentages of Hb saturation (X axis) against the PO2 (Y axis), are plotted. For oxy Hb the curve is “S” or sigmoid shaped and for myoglobin the dissociation curve is rectangular hyperbola in shape.
Under normal conditions, at a PO2 of 100mm. Hg, blood leaving the lungs is 95 – 98% saturated with O2. Further increase in PO2 do not increase O2 carrying capacity of blood but increase the amount of O2 in physical solution according to Henry’s law.
One gram of Hb can transport 1.34 ml of O2. The average hemoglobin concentration is 15 g/ 100 ml of blood. In atrial blood at a PO2 of 100 mm.Hg, Hb is 97.5% saturated with O2 and transport 15 x 1.34 x 97.5/100 = 19.6 ml / 100 ml or 19.6 volumes percent.
100 ml of blood carries 19.9 ml of O2 of which 19.6 ml in combination with hemoglobin and remaining 0.3 ml in physical solution As the arterial blood reaches the tissue, O2 is unloaded from the blood to tissues, the O2 saturation falls to about 72% in venous blood.
At 72% saturation of O2, the blood will have 14.5 ml O2. Hence each 100 ml blood unloads approximately 5 volume percent of O2 to tissues. PO2 of venous blood is 40 mm Hg.
Shift of dissociation curve to right results is greater release of O2 from oxy Hb due to decreased affinity of Hb to O2. A shift to left increases the affinity of Hb to O2 and decreases O2 released from Hb. Variation occur in O2 dissociation of foetus and adults.
- The extent of oxygen dissociation from the oxy hemoglobin dissociation curve is influences by-
- PO2
- PCO2
- H+ ion concentration
- Temperature
- Concentration of DPG (2 – 3 diphosphoglycerate) in erythrocytes.
Increase in H+ ion concentration and CO2 level shifts the curve to down the right as also increase in temperature and 2 – 3 DPG. The 2-3 DPG level increases in hypoxia. Shifting the curve to down and right causes increase in release of O2 from the Hb.
The shift of oxy-Hb dissociation curve to down and right by increased CO2 tension is termed as Bohr’s effect. In tissues as O2 is unloaded, CO2 is simultaneously taken up by blood and this enhances unloading of O2.