TABLE OF CONTENTS
Electrocardiography or ECG in animals
Electrocardiography (ECG) is the recording of the electrical changes occurring during the process of depolarization and repolarization of the heart. The instrument, the electrocardiograph is used to take the recording known as elctrocardiogram.
Einthoven (1908) first recorded ECG using bipolar leads. The depolarisation and repolarisation of cardiac muscle generate electrical current. It flows in a circuitous route from depolarized to polarized area, which can be measured by the electrodes (leads) which are placed on the surface of the body surrounding the heart.
ECG is recorded as deflection or waves using lead systems. A lead is connection of two points /parts of the body through electrodes and wires with the electrocardiograph. If the electrical impulse travels towards the positive pole, a positive (upward) deflection occurs. If the impulse moves towards negative lead the deflection is negative (downward).
Common lead systems
Bipolar limb leads (by Einthoven)
- Lead I: Right arm, (- ve) & Left arm (+ ve)
- Lead II: Right arm (- ve) & Left leg (+ ve)
- Lead III: Left arm (- ve) & Left leg (+ ve)
- The right hind leg is connected to the earth.
- The triangle formed by the three lead systems with the heart at the centre is referred to as Einthoven’s triangle.
Augmented unipolar limb leads
- Basically, an augmented unipolar limb lead compares the electrical activity at the reference limb (right arm, or left arm or left leg) to the sum of the electrical activity at the other two limbs. Unipolar leads permit more precise location of direction of electrical potential within the myocardium.
- Lead aVR: Right arm (+ ve) & Left arm and left leg (- ve)
- Lead aVL: Left arm (+ ve) & Right arm and left leg (- ve)
- Lead aVF: Left leg (+ve) & Right and left arm (- ve)
- Among the augmented unipolar limb leads only aVR shows inverted deflections when compared to others.
Unipolar chest leads (Exploring/ precordial/ chest leads)
- These leads record the potential from the anterior surface of the heart, from right side to left side. A central chest lead is placed at different locations on the chest and these leads are designated as V leads. The common positions of V leads are
- V1 – 4th intercostal space at the right sternal border
- V2 – 4th intercostal space at the left sternal border
- V3 – equidistant between V2 and V4
- V4 – at mid clavicular line in the 5th intercostal space
- V5 – anterior axillary line at the same level as V4.
- V6 – midaxillary line in the 5th intercostal space
- V7 – posterior axillary line in the 5th intercostal space
- V8 – posterior scapular line
- These electrodes are positive poles, which are compared with the average voltage across the three standard leads (Lead I to III). These leads record the potentials from the anterior surface of the heart and provide additional information about right and left heart enlargement.
ECG waves
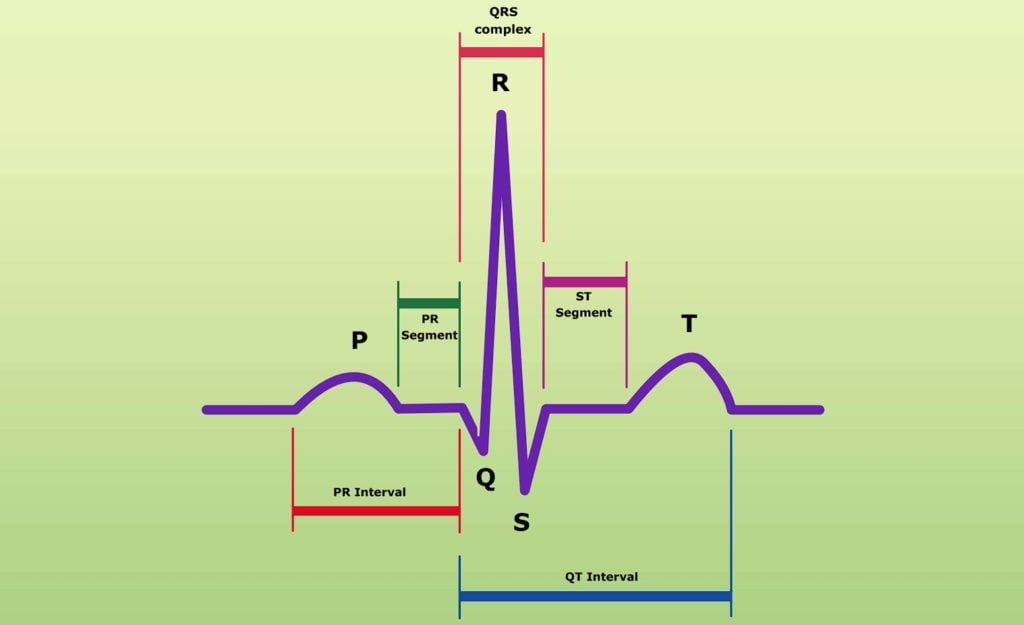
Deflection of normal ECG are referred as P, QRS and T waves

P wave
P wave is a positive wave that indicates the sum of all the electrical potentials produced during the depolarisation of both atria and the spreading of the electrical activity from S.A node throughout the atrial musculature. It slightly precedes atrial systole and initiates the atrial contraction. There is a very brief interval between P wave and atrial systole, which is due to time lag between electrical and mechanical events.
QRS wave
QRS complex shows the spreading depolarization wave through the ventricular muscles, thus initiates ventricular systole (depolarization). QRS wave precedes isovolumetric contraction.
T wave
The positive (upward) deflection precedes ventricular diastole and indicates the initiation of ventricular repolarization (relaxation). ECG has no separate deflection or wave for atrial relaxation, which is due to the fusion of this deflection with QRS complex.
ECG intervals
P-Q or P-R interval is the duration of time between the beginning of the P wave and the beginning of the QRS wave. It indicates the time of excitation wave travel from SA node to purkinje system which includes short A.V nodal delay after the atrial contraction to permit complete ventricular filling. P-R interval indicates atrio ventricular conduction time. Normally P-R interval is 0.1 sec.
Q-T interval is the duration from the beginning of Q wave to the end of T wave which indicates the duration from initiation of ventricular depolarization to completion of repolarization or ventricular contraction.
S-T interval is the duration between the beginning of S wave and the beginning of T wave during which the ventricles remain depolarized.
Average heart rate/min and ECG intervals
| Species | Average heart rate | PR (in sec.) | QRS (in sec.) | QT (in sec.) |
| Cattle | 70 (48 – 84) | 0.18 | 0.09 | 0.39 |
| Horse | 35 (28 – 40) | 0.30 | 0.11 | 0.52 |
| Swine | 100 (70-120) | 0.13 | 0.06 | 0.32 |
| Sheep/goat | 100 (72-120) | 0.13 | 0.04 | 0.28 |
| Dog | 100 (70-120) | 0.10 | – | 0.06 |
| Cat | 130(120-140) | 0.07 | 0.04 | 0.17 |
The time between two successive P waves is P-P interval, corresponds to time between atrial contractions which can be used to calculate the number of atrial contractions per minute.
Similarly, R-R interval can be used to calculate the ventricular rate.
Significance of ECG
ECG is a non-invasive method to evaluate cardiac function. and to diagnose ventricular hypertrophy. and to evaluate conduction system blocks, myocardial infarction and drug effects etc.